FuturesAI Order Flow: How to Price an Absorption Trade
Quick answer
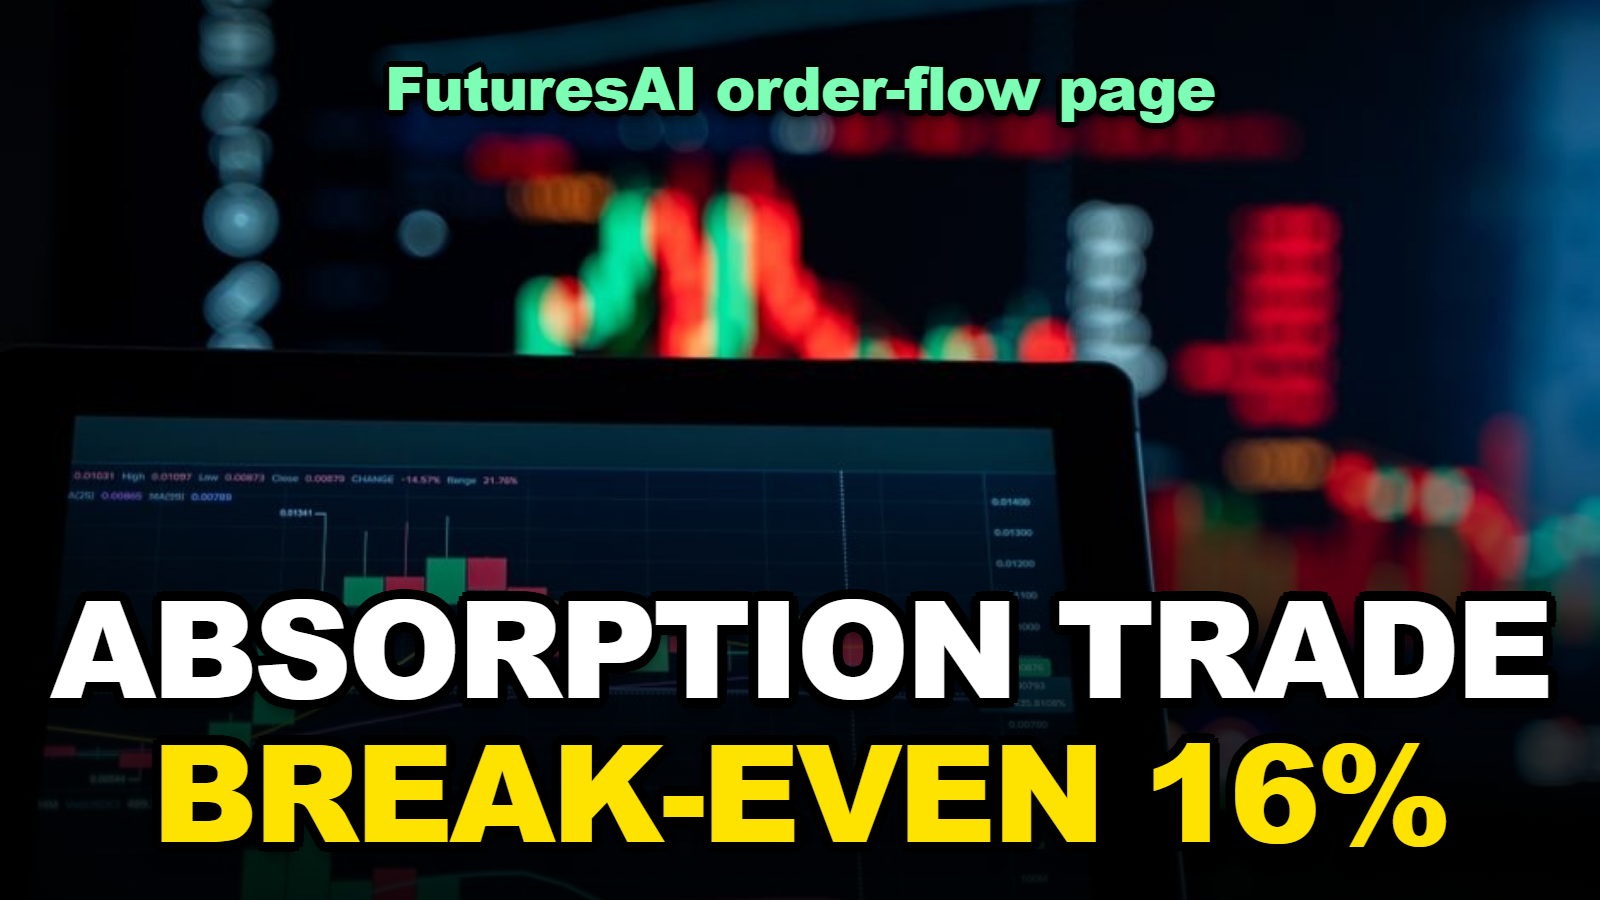
An absorption trade is a long placed on top of a bid wall that keeps soaking up market sells. FuturesAI’s order-flow guide lists a 72% absorption accuracy and a +3.8% average bounce, with no sample size or period attached. This post ignores the 72% and asks a narrower question: with a stop just under the wall and Bitget fees paid at the standard rate or through FuturesAI payback, how often does the trade need to work? The answer lands between 14% and 16% on a $10,000 position once a slippage allowance is included. The catch is that tight stops under walls get run, and about 15% of walls are estimated to be spoofs.
A 480 BTC bid wall sitting between $61,800 and $62,000, eating 1,200 BTC of market sells over 45 minutes while the cumulative delta flips positive. That is the example FuturesAI uses to explain absorption, and the page says price bounced 4.8% over the next 12 hours. It reads like free money. Order-flow setups usually do, right up until the wall vanishes.
So before anyone trades a footprint chart, it is worth doing the arithmetic that the guide leaves out: fees, stop distance, and the hit rate the trade actually needs. None of this is investment advice. Leveraged futures can lose the full principal, and the numbers below are a model, not a forecast.
What This Works Out
- What does the FuturesAI order-flow page actually claim?
- How do you turn an absorption setup into numbers?
- What hit rate does an absorption trade need to break even?
- What is the expected value at the claimed 72%?
- How much of the edge is fee payback?
- Where the Model Breaks
- Tips
- Warnings
- FAQ
What does the FuturesAI order-flow page actually claim?
FuturesAI’s order-flow analysis guide, live at futuresai.io as of October 31, 2026, lists four headline figures: 72% absorption accuracy, a 65% delta-divergence win rate, a +3.8% average bounce after absorption, and an estimated spoof rate of about 15% (futuresai.io).
When I checked the page for the methodology behind those figures, I found that none of the four carries a sample size, a date range, or a definition of what counts as a successful absorption. The one worked example, BTC at $62,000, is dated February 8 with no year. That is not a reason to dismiss the signal. It is a reason to build the calculation so that it does not depend on the 72%.
The definitions on the page are the useful part:
- Delta is buy volume minus sell volume. Positive divergence at a low is bullish.
- Absorption is a large resting limit order soaking up market orders without price moving through it. Bid absorption at support is the bullish case.
- Imbalance is the bid-to-ask ratio at one price. The page treats stacked 3:1 bid imbalances as bullish.
- Exhaustion is high volume with no price movement, read as the aggressive side running out of fuel.
Those four give you an entry trigger. They do not give you a stop, a target, or a fee bill. That is the rest of this post.
How do you turn an absorption setup into numbers?
An absorption long becomes a calculation once you fix five inputs: the entry price at the top of the wall, a stop just below the wall’s lower edge, a target taken from the page’s +3.8% average bounce, the position size, and the round-trip fee on the exchange you use.
Using FuturesAI’s own example as the template, and assuming a trader who takes both legs with market orders on Bitget:
| Input | Value | Where it comes from |
|---|---|---|
| Entry | $62,000 (top of the wall) | FuturesAI example |
| Stop | $61,700, 0.48% below entry | $100 under the $61,800 wall base; my assumption |
| Target | $64,356, 3.8% above entry | Page’s average bounce after absorption |
| Position | $10,000 notional, $2,000 margin at 5x | Model size |
| Bitget taker fee, standard | 0.06% per leg, 0.12% round trip | FuturesAI Bitget payback page |
| Bitget taker fee via FuturesAI | 0.015% per leg effective, 0.03% round trip | 50% fee discount plus 50% payback, same page |
| Slippage | 0.05% per leg, 0.10% round trip | My assumption; the page gives none |
The effective Bitget rate is published on FuturesAI’s Bitget page: a 0.06% market fee becomes 0.015% once the 50% discount and the 50% payback are both applied, and the payback lands in the FuturesAI balance once a day (futuresai.io/en/payback/bitget).
On $10,000 the money looks like this. A win is $380 before costs. A loss at the stop is $48 before costs. Standard fees take $12 per round trip and slippage takes another $10. Through FuturesAI the fee line drops to $3 and slippage stays at $10.
What hit rate does an absorption trade need to break even?
With a 0.48% stop, a 3.8% target and $22 of standard fees and slippage on a $10,000 Bitget position, an absorption long breaks even at a 16.4% hit rate; with FuturesAI’s effective fee the figure is 14.3%.
Break-even hit rate is the net loss divided by the sum of the net win and the net loss. This is where spreadsheets go wrong, so here it is in full.
Net win = $380 − $22 = $358. Net loss = $48 + $22 = $70. Break-even p = 70 / (358 + 70) = 16.4% at standard fees. Through FuturesAI: net win = $380 − $13 = $367, net loss = $48 + $13 = $61, p = 61 / 428 = 14.3%. Strip out the slippage allowance and the two figures fall to 14.0% and 11.9%.
| Stop distance | Net loss, standard | Break-even, standard | Net loss, via FuturesAI | Break-even, via FuturesAI |
|---|---|---|---|---|
| 0.48% ($61,700) | $70 | 16.4% | $61 | 14.3% |
| 1.0% ($61,380) | $122 | 25.4% | $113 | 23.5% |
| 2.0% ($60,760) | $222 | 38.3% | $213 | 36.7% |
| 3.8% (stop equals target) | $402 | 52.9% | $393 | 51.7% |
Two things jump out. The break-even is low because the stop is tight relative to the bounce, not because of anything clever. And the fee route moves the number by about two points at every stop distance. Payback helps; it does not create the edge.
Honestly, the 0.48% row is the one to distrust most.
What is the expected value at the claimed 72%?
If FuturesAI’s listed 72% absorption accuracy held, the $10,000 trade in this model would return about $238 per attempt at standard Bitget fees and $247 through FuturesAI, but because the page gives no sample behind the 72%, the honest way to read that is as the top row of a sensitivity table rather than a forecast.
| Hit rate | EV per trade, standard fees | EV per trade, via FuturesAI | What it would mean |
|---|---|---|---|
| 72% (page’s claim) | $238 | $247 | Only credible with a sample behind it |
| 61% (72% less a 15% spoof rate) | $191 | $200 | If every spoofed wall is a loss |
| 50% | $144 | $153 | Coin flip still pays with this stop |
| 30% | $58 | $67 | Stops being run most of the time |
| 16% | −$2 | $7 | Break-even zone |
EV = p × net win − (1 − p) × net loss. At 50%: 0.5 × $358 − 0.5 × $70 = $144. At 30%: 0.3 × $358 − 0.7 × $70 = $107.4 − $49 = $58.4. The spoof row simply multiplies 72% by 0.85, which assumes a pulled wall always stops you out and that the 72% did not already exclude spoofs. The page does not say either way.
If you’ve ever watched a wall evaporate the second price touches it, you know which row you live in. The model’s weakness is not the fee column. It is that a 0.48% stop under a wall is exactly where a large seller would push to trigger stops before the real bounce.
How much of the edge is fee payback?
On a $10,000 absorption trade taken with market orders on Bitget through FuturesAI, the payback itself is $3 per round trip: the discounted fee is 0.03% per leg, or $6 per round trip, and FuturesAI returns half of that, with withdrawals from the FuturesAI balance starting at 50 USDT according to its Bitget page.
Per trade that is small. Per month it is the difference between the two fee columns above, and it is the only number in this post that does not depend on whether the wall holds.
| Trades per month at $10,000 | Standard fees paid | Net fee via FuturesAI after payback | Payback credited | Months to the 50 USDT withdrawal |
|---|---|---|---|---|
| 10 | $120 | $30 | $30 | 2 |
| 20 | $240 | $60 | $60 | 1 |
| 40 | $480 | $120 | $120 | under 1 |
Twenty absorption trades a month is a realistic cadence for someone watching BTC and ETH footprints a few hours a day. At that pace the fee saving is $180 a month, which is a little more than one losing trade at the 1% stop. Worth having. Not worth trading more often to get, which is the trap the next section covers. For the mechanics of reaching the first withdrawal, see FuturesAI Payback: How Long Until Your First 50 USDT.
Where the Model Breaks
Four things on FuturesAI’s own page undercut the clean numbers above, and when I compared them with the table in the break-even section, each one pushes the real hit rate down or the real loss up.
- Spoofing. The page estimates about 15% of visible walls are spoofs that get pulled. A pulled wall does not just fail; it removes the support your stop was hiding under.
- Iceberg orders. Hidden liquidity “can significantly distort visible order book data”, in the page’s words. A wall can be bigger or smaller than it looks, in both directions.
- Thin books. Crypto order books are thinner than traditional markets, so a 1,200 BTC sell burst can gap through a $100 stop. Your fill is then worse than the stop price, and the 0.48% row quietly becomes the 1% row.
- Overtrading for payback. FuturesAI’s Bitget page says high-frequency trading, click farming and wash trading are treated as rule violations by the exchange, and that FuturesAI applies the same suspension when the exchange stops commissions for a UID. Chasing the $3 is how people lose the whole $60 a month.
The page also tells you to confirm order-flow signals with volume and price action. Translated into this model: do not take the trade on the wall alone, because the only thing that made the break-even look easy was the assumption that the wall holds for $100.
For the general version of this calculation, where the stop and target come from a backtest rather than a single setup, the earlier post on FuturesAI Payback: Break-Even Win Rate After Fees walks through the same formula.
Tips
- Set the stop from the wall’s base, not from your entry. The 0.48% here only exists because the wall was $200 thick.
- Re-run the break-even with a 1% stop before you trade. If the setup only works at 0.48%, it only works until the first stop run.
- Use limit entries where the wall allows it. The Bitget limit fee through FuturesAI is 0.005% effective against 0.015% for market, and that halves the fee line again.
- Log every absorption trade with the wall size, how long it held, and whether it was pulled. After 30 trades you will have a hit rate with a sample, which the page does not give you.
Warnings
- This is not investment advice. Leveraged crypto futures can lose the entire principal, and the 5x model here would be liquidated on a move of roughly 20% against the position before fees.
- The 72%, 65%, +3.8% and 15% figures are FuturesAI’s own statements with no published sample size or period. Treat them as claims to test, not results.
- Payback is credited only to accounts opened through the FuturesAI link within the rules on its exchange page; an older Bitget account that used another referral code is not eligible.
- Fee rates and payback percentages can change. Check the live Bitget page on FuturesAI on the day you trade.
FAQ
Does the break-even change if I use limit orders instead of market orders?
Yes, in your favour. On Bitget through FuturesAI the effective limit fee is 0.005% per leg against 0.015% for market, so a $10,000 round trip costs $1 instead of $3. You also avoid most of the slippage assumption. The risk is that a limit entry above a wall may never fill when the bounce is fast.
What stop distance makes an absorption trade a coin flip?
In this model a stop equal to the 3.8% target gives a break-even near 52% at standard Bitget fees and 51.7% through FuturesAI. Anything tighter than the target needs less than a coin flip to break even, which is why stop placement matters more than the fee route.
Is the 72% absorption accuracy a FuturesAI signal win rate?
No. It is a figure on the order-flow educational page, separate from the prediction scoreboard that scores FuturesAI’s frozen calls. The page does not state how the 72% was measured, so it should not be compared with the scoreboard’s published results.
Sources
- FuturesAI: Order Flow Analysis, Reading the Tape in Crypto Markets (definitions, listed statistics, BTC $62,000 example)
- FuturesAI: Bitget payback (fee rates, 50% discount and payback, 50 USDT minimum withdrawal, HFT clause)
- FuturesAI: Partner exchanges (effective taker fees by exchange)
🔗 Related guides
📌 Hub guide: For the full earn-save-flip playbook — pricing, taxes, cashback, and collectible margins — see the Income & Smart Shopping Hub.
Written by Jordan Lee, editor. Figures taken from FuturesAI’s live pages on October 31, 2026; stop, position size and slippage are stated assumptions. Not investment advice. Futures trading with leverage can lose the full principal.