
FuturesAI UP vs DOWN Calls: How to Read the Return Gap
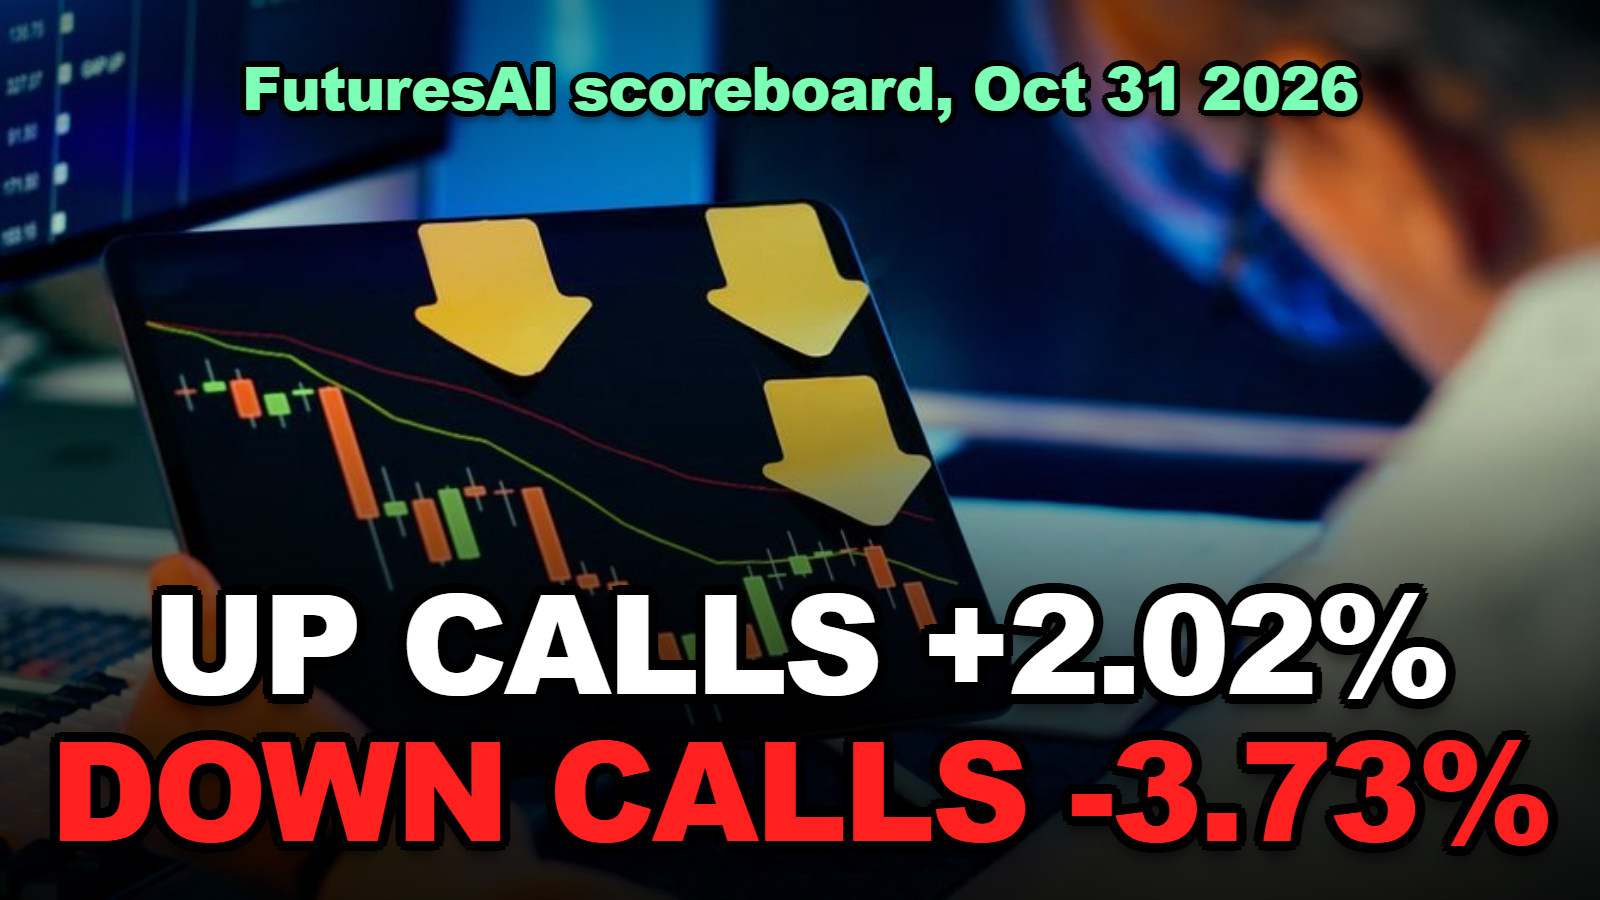
Short answer: FuturesAI’s public scoreboard, read on October 31, 2026, shows 183 UP calls returning +2.02% on average and 113 DOWN calls returning -3.73% on average when traded as predicted. Blend them and you get the -0.18% per prediction the site reports. The direction split is the single biggest filter in the data, and it still does not make the book beat the index, which rose 3.19% over the same windows. Fees are not in those numbers. This article adds them.
Forty-six percent accuracy and a positive average return can live in the same scoreboard. FuturesAI’s UP calls prove it: 47.7% of them were right, and traded as a group they still averaged +2.02%. The DOWN calls were the mirror image, and they are where the whole book lost its money.
This is a worked recalculation of the numbers FuturesAI publishes on its AI Prediction Scoreboard, read on October 31, 2026 (the page lists its last automatic check as October 28, 2026). AI signals there are described by FuturesAI itself as observation scores, not buy or sell recommendations. Nothing here is investment advice, and leveraged trading can lose the entire principal.
What We Recalculate
- What does the FuturesAI scoreboard say about UP and DOWN calls?
- How do two averages produce a -0.18% book?
- What would $1,000 per call have done, before and after fees?
- Why did DOWN calls lose while UP calls gained?
- How do you use the direction split without fooling yourself?
- What the Split Cannot Tell You
What does the FuturesAI scoreboard say about UP and DOWN calls?
FuturesAI’s scoreboard, read on October 31, 2026, reports that trading every one of 296 scored predictions with the same amount would have returned -0.18% per prediction, with UP predictions averaging +2.02% across 183 calls and DOWN predictions averaging -3.73% across 113 calls, before fees.
| Scoreboard figure (read Oct 31, 2026) | Value | Sample |
|---|---|---|
| Average return per prediction, traded as predicted | -0.18% | 296 predictions |
| All returns added up | -52.7% | 296 predictions |
| Index over the same windows (KOSPI, S&P 500, BTC) | +3.19% | Daily closes |
| Gap to the index | -3.36 percentage points | |
| UP predictions, average return | +2.02% | 183 calls |
| DOWN predictions, average return | -3.73% | 113 calls |
| Payoff ratio (gained when right ÷ lost when wrong) | 1.14 | |
| Direction accuracy, all calls | 45.9% | 136 of 296 |
| Direction accuracy, UP calls | 47.7% | 94 of 197 |
| Direction accuracy, DOWN calls | 43.0% | 49 of 114 |
Two different denominators appear on the page. The return figures use 296 predictions with price data; the accuracy-by-direction figures use 311 scored predictions. The scoreboard also lists 21 pending calls waiting for their deadline. I use each number with its own denominator and do not mix them.
The scoring method, as the page states it: bought at the price when the prediction was made, sold at the scoring-day price, no fees, and the index uses daily closes so each window can be off by up to a day.
How do two averages produce a -0.18% book?
The -0.18% blended return on FuturesAI’s scoreboard is the size-weighted average of 183 UP calls at +2.02% and 113 DOWN calls at -3.73%, which works out to -0.175% per prediction and -51.8 percentage points in total, matching the published -0.18% and -52.7% after rounding.
When I compared the two direction averages against the blended figure, I noticed that they reconcile almost exactly, which is worth a line on its own: the page is internally consistent, not a marketing average floating free of its parts.
| Reconstruction | Calls | Average return | Contribution (calls × average) |
|---|---|---|---|
| UP calls | 183 | +2.02% | +369.7 points |
| DOWN calls | 113 | -3.73% | -421.5 points |
| Whole book | 296 | -0.175% (site: -0.18%) | -51.8 points (site: -52.7) |
| UP calls only, versus the index | 183 | +2.02% vs +3.19% | Still 1.17 points behind buy-and-hold |
The last row is the one people skip. Dropping every DOWN call turns a losing book into a gaining one, and it still trails simply holding the index over the same windows. A filter that improves a signal is not the same as a signal that beats the market.
The small difference between -51.8 and -52.7 comes from the site rounding the two averages to two decimals before I multiplied them back. That is rounding, not a discrepancy.
What would $1,000 per call have done, before and after fees?
Putting a hypothetical $1,000 on each of FuturesAI’s 296 scored predictions would have produced a net loss of about $518 before fees, made up of a $3,697 gain on the 183 UP calls and a $4,215 loss on the 113 DOWN calls, using the direction averages on the scoreboard read October 31, 2026.
The scoreboard excludes fees. For the crypto portion of the book, FuturesAI’s payback page lists Bitget’s market (taker) fee at 0.06%, falling to an effective 0.015% once the 50% fee discount and 50% payback shown there are applied. A round trip is two fills, so a $1,000 crypto position costs $1.20 at the headline rate or $0.30 at the effective rate.
| Hypothetical $1,000 per call | Gross result (scoreboard averages) | Round-trip fees at 0.12% | Round-trip fees at 0.03% (effective) |
|---|---|---|---|
| 183 UP calls | +$3,697 | -$220 | -$55 |
| 113 DOWN calls | -$4,215 | -$136 | -$34 |
| All 296 calls | -$518 | -$355 (net -$873) | -$89 (net -$607) |
| Crypto subset only: 84 calls, +3.29% average | +$2,764 | -$101 (net +$2,663) | -$25 (net +$2,739) |
A caution on the fee columns. The scoreboard mixes Korean stocks, US stocks and crypto, and only the crypto calls would actually trade on a perpetual futures venue at those rates. Stock commissions differ by broker and country. I apply the crypto fee to the whole book only to show the scale, and the crypto-only row is the one where the fee assumption is clean.
The crypto subset is also where the scoreboard’s accuracy is highest: 57.1%, or 48 of 84, with a traded return of +3.29% against +6.72% for the market over the same windows. Even there the signal trailed the asset it was predicting. The break-even win-rate calculation shows how little room a 0.12% round trip leaves at these hit rates.
Why did DOWN calls lose while UP calls gained?
FuturesAI’s DOWN calls lost an average 3.73% while its UP calls gained 2.02% because the reference markets rose 3.19% across the scoring windows, so a short position had to overcome the drift of the market as well as be right, while a long position collected that drift even when it was wrong.
The accuracy numbers make the same point from a different angle. UP calls were right 47.7% of the time and still averaged a gain; DOWN calls were right 43.0% of the time and averaged a loss roughly 1.8 times as large. Both figures sit below the 50% a coin would give you. What separated them was not accuracy but what happened on the wrong calls: a wrong long in a rising market loses a little, a wrong short loses a lot.
When I checked the scoring ledger on October 31, 2026, I found that the visible Korean-stock DOWN calls that hit did so by wide margins, around 22% to 33% in the most recent entries, while the misses on UP calls for large names landed at 8% to 23% against the call. Those are a handful of recent rows, not the whole ledger, so treat them as texture rather than statistics.
Honestly, the cleanest reading is regime. The scoreboard’s windows coincided with a rising reference index. In a falling period the direction split could invert, and the ledger is the only way to see it; the sample-size guide explains why 113 DOWN calls is enough to notice a gap but not enough to call it permanent.
How do you use the direction split without fooling yourself?
Using FuturesAI’s UP-versus-DOWN return gap as a filter is reasonable only if you recheck it against the live scoreboard each month, size for the market’s own drift, and add fees, because the gap is a product of the period as much as of the model.
Read the direction rows on the live page first
Open the scoreboard and write down the UP and DOWN counts and averages for today. The figures above are from October 31, 2026 and the site updates them as calls resolve.
Check the market line beside them
The “market over the same windows” figure tells you whether the period favoured longs. If it is positive, expect UP calls to look better than they are; if it is negative, expect the reverse.
Compare the sample per direction, not the total
A 296-call book is one thing; 113 DOWN calls is a third of it. Any filter that throws away a third of the data has a wider error band than the headline accuracy suggests.
Add your venue’s round-trip fee
Multiply the number of calls you would actually take by two fills at your fee tier. On Bitget through FuturesAI’s payback link that is 0.03% a round trip after the discount and payback the site lists; elsewhere it is often 0.1% or more. The Kelly sizing guide covers what those fees do to position size.
Decide what the filter is for
FuturesAI describes its scores as observation tools, and this calculation supports that description. Skipping DOWN calls would have turned a loss into a smaller shortfall against the index, not into outperformance. Use the split to avoid the weaker half of a signal, not to expect the stronger half to beat holding.
What the Split Cannot Tell You
Four things are missing from the direction split, and each one limits what you can conclude.
- No win-and-loss sizes per direction. The page gives one payoff ratio, 1.14, for the whole book. Without the average winning and losing move for UP and DOWN separately, you cannot compute a break-even accuracy for each side.
- No direction split per market. Crypto is 57.1% accurate overall, but the page does not say whether that comes from UP calls, DOWN calls or both.
- No fees, slippage or funding. Every scoreboard number is gross. Funding on a perpetual held for a 20-day window can exceed the trading fee.
- A one-day index lag. The site says the index uses daily closes and each window can be off by up to a day, so the 3.19% comparison is approximate.
Here’s where people get tripped up: a scoreboard this transparent invites you to find the one slice that worked and trade it. The slice that worked here, UP calls at +2.02%, still lost to the index.
Tips
- Save the scoreboard numbers with the date each time you read them; the direction gap will drift as the 21 pending calls resolve.
- Run the reconstruction yourself: calls times average for each direction, summed and divided by the total. If it does not reconcile, something on the page changed.
- Treat the crypto-only row as the only one where a perpetual-futures fee assumption is honest.
- Read the market line before the accuracy line, every time.
Warnings
- FuturesAI’s own measured accuracy sits between 43% and 57% depending on the slice; nothing here changes that range or promises a profit.
- All figures are gross of fees, slippage and funding, and the index comparison can be off by a day.
- The direction gap reflects a period when the reference index rose 3.19%; it can reverse.
- Not investment advice. Leveraged futures can lose your entire principal.
FAQ
Does skipping FuturesAI DOWN calls make the signal profitable?
On the scoreboard read October 31, 2026, the 183 UP calls averaged +2.02% before fees, so an UP-only book would have gained. It would still have trailed the reference index, which rose 3.19% over the same windows, by 1.17 percentage points.
Why is FuturesAI UP-call accuracy under 50% but the return positive?
Accuracy counts how often the direction was right; return weights each call by how far price moved. In a period where the reference markets rose 3.19%, wrong UP calls lost less than right UP calls gained, so 47.7% accuracy still produced a +2.02% average.
Are FuturesAI scoreboard returns net of trading fees?
No. The scoreboard states that returns are calculated with no fees, buying at the prediction price and selling at the scoring-day price. A Bitget round trip through FuturesAI’s payback link costs about 0.03% after the listed discount and payback, or 0.12% at the headline taker rate.
Sources
- FuturesAI: AI Prediction Scoreboard (read Oct 31, 2026; last auto-check listed as Oct 28, 2026)
- FuturesAI: Partner exchanges and fee payback (Bitget 0.06% market fee, 0.015% effective)
Next step: open the scoreboard, copy the UP and DOWN rows with today’s date, and run the four-line reconstruction above before you decide anything. For how long a losing run at these hit rates can last, see FuturesAI Hit Rate: How Long a Losing Streak Gets.
Fact-checked against FuturesAI’s public scoreboard and payback page as of October 31, 2026. Worked examples are hypothetical and gross of slippage and funding. Not investment advice.
🔗 Related guides