The Win Rate You Actually Need: Why 55% Still Loses Money (2026)
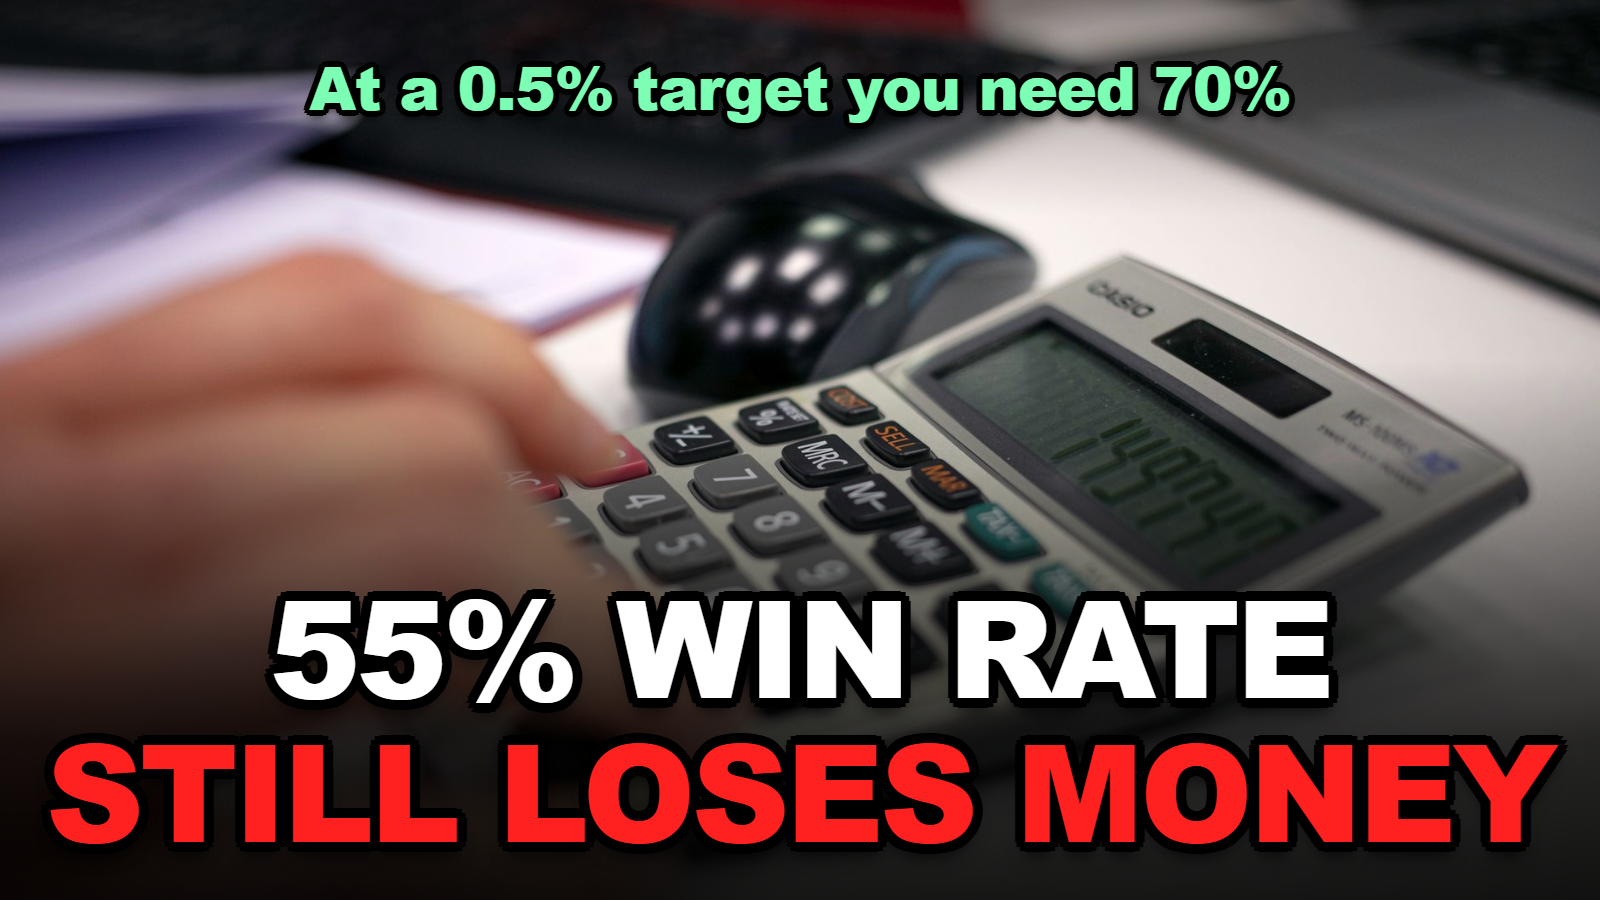
A 55% win rate sounds like an edge. Whether it is one depends entirely on how far you are trying to travel per trade. Taking profit at 0.5% with a 0.2% round-trip cost, you need a 70% win rate just to break even. At a 3% target the same cost only needs 53.3%. The formula is one line, and running your own numbers through it explains most of the gap between a strategy that looks good on paper and an account that grinds down.
Disclosure: the measured figures used as a worked example below are from FuturesAI, which is our own product. We are using them because they are published and checkable, and because they make the unflattering half of the point.
Jump to a Section
- The One Line of Arithmetic
- The Table Worth Keeping
- Why This Kills Short Targets Specifically
- A Worked Example With Real Numbers
- Three Levers, and Which One to Pull
- What Win Rate Does Not Tell You
The One Line of Arithmetic
For a strategy that takes profit at one level and cuts at another, the win rate at which you break even is:
break-even win rate = (loss size + cost) ÷ (win size + loss size)
If your target and your stop are the same distance — call it R — that simplifies to something you can do in your head:
break-even = 50% + (cost ÷ 2R)
Cost here is the full round trip: entry fee, exit fee, and the slippage you actually pay on both. Not the advertised maker rate — what leaves your account.
The shape of that second formula is the whole article. Cost sits in the numerator and your target sits in the denominator, so halving your target does not halve your edge requirement — it doubles the penalty.
The Table Worth Keeping
Break-even win rate by target size and round-trip cost:
| Target = stop | Cost 0.1% | Cost 0.2% | Cost 0.4% |
|---|---|---|---|
| 0.5% | 60.0% | 70.0% | 90.0% |
| 1% | 55.0% | 60.0% | 70.0% |
| 2% | 52.5% | 55.0% | 60.0% |
| 3% | 51.7% | 53.3% | 56.7% |
| 5% | 51.0% | 52.0% | 54.0% |
Read the top-left corner against the bottom-right. Same cost structure, same coin-flip underlying — but a 0.5% scalper at 0.4% cost needs to be right nine times in ten, while a 5% swing trader at 0.1% cost needs 51%. Those are not the same job.
Note also what the table does not say: nothing here is about being good at predicting. Every cell assumes your wins and losses are the same size. The requirement is imposed by arithmetic before any skill enters.
Why This Kills Short Targets Specifically
Cost is roughly fixed per trade. Your target is not. So the shorter the distance you are trying to capture, the larger the fraction of it that costs consume.
Put concretely: at a 0.2% round trip, a 0.5% target hands over 40% of the move before you start. A 5% target hands over 4%. The trader taking small, frequent profits is not running a faster version of the same strategy — they are running a strategy with a structurally higher bar, and the bar rises as they trade more often.
This is also why “it worked in the backtest” is so often followed by “it does not work live”. A backtest with no fees, or with fees but no slippage, moves every cell in that table down by several points. At a 1% target, going from 0.1% to 0.2% assumed cost moves the break-even from 55% to 60% — enough to flip a profitable-looking system into a losing one without changing a single trade.
A Worked Example With Real Numbers
We publish the scoring data for our own system, so it makes a usable example — including the part that does not flatter us.
Across 26,630 scored samples on 59 tickers, the working score band won 54.6% of the time. Run that through the formula backwards and you get the minimum target size at which 54.6% is worth anything.
| Round-trip cost | Minimum target for 54.6% to break even |
|---|---|
| 0.1% | 1.09% |
| 0.2% | 2.17% |
| 0.4% | 4.35% |
Now compare against what the same system actually produced at different holding periods in backtest, with a 20 basis point round trip applied: +0.41% average per trade at a one-day horizon, +2.83% at five days.
The one-day figure is far below the 2.17% the arithmetic demands. The five-day figure clears it. That is not two different qualities of prediction — it is the same signal measured over a distance long enough to outrun its costs, and a distance too short to.
We had already observed empirically that the signal is weakest at the shortest horizon. The formula explains why that was always going to be true, and it would be true for any signal with a similar win rate.
Three Levers, and Which One to Pull
You can move only three things. In order of how much they help:
- Widen the target. Look at the table again — this is by far the strongest lever, because the target sits in the denominator. Going from 1% to 3% at a 0.2% cost drops your requirement from 60% to 53.3%. Nothing else comes close.
- Lengthen the holding period. This is the same lever wearing different clothes: longer holds allow larger targets. It also reduces how many round trips you pay per unit of return, which compounds the benefit.
- Cut the cost. Real, but bounded. Halving a 0.2% round trip to 0.1% at a 1% target moves break-even from 60% to 55% — worth having, and worth more the shorter your target is. If you trade frequently at small targets, this is the lever that matters most to you, which is exactly the situation where you are already fighting the arithmetic.
What you cannot do is raise your win rate by wanting to. Which is why the honest first move, when a strategy is not working, is to check whether the win rate it would need is one that anybody achieves.
What Win Rate Does Not Tell You
Everything above assumes symmetrical wins and losses. Real strategies are rarely symmetrical, and that changes the answer in both directions.
A system that wins 40% of the time can be strongly profitable if its wins are three times its losses — trend-following typically looks like this, and its low win rate is a feature of letting winners run. Conversely a 70% win rate can lose money if the 30% of losses are large, which is what happens when a strategy takes small profits and holds losers hoping for recovery.
So use the full formula rather than the simplified one whenever your target and stop differ: (loss + cost) ÷ (win + loss). And treat any advertised win rate quoted without an average win, an average loss and a cost assumption as a number that cannot be evaluated — not a good one or a bad one, just an uninterpretable one.
The published scoring data we used here, including the confidence tier that has too few samples to claim anything from, is at FuturesAI if you want to run the same check yourself.
🔗 Related
FAQ
Does this apply to spot trading too?
Yes. The formula is about costs against target size and is indifferent to instrument. Leverage does not change the break-even win rate either — it scales wins, losses and fees together.
What should I use as my cost figure?
Measure it rather than quoting the fee schedule. Take ten closed trades, total everything that left your account across entry and exit, and divide by the notional traded. That number includes the slippage the fee schedule does not mention.
Is funding included?
Not in the formula above. If you hold across funding settlements, add the funding paid to your cost figure — it pushes the break-even higher the longer you hold, which partly offsets the benefit of longer horizons.
My win rate is above the break-even. Am I profitable?
Over a large enough sample, and if your average win and loss really are what you assumed. Both assumptions fail more often than people expect, which is why the full formula and a real measurement of your own trades beat any table.
Sources
- FuturesAI public scoring endpoint — 26,630 samples across 59 tickers at a 20-day horizon, 54.6% in the working score band. Retrieved September 25, 2026.
- FuturesAI public backtest endpoint — single-ticker runs at 1-day and 5-day horizons with a 20 basis point round-trip fee, producing +0.41% and +2.83% average per trade. Retrieved September 25, 2026.
- futuresai.io — public scoring dashboard.
This article is for informational purposes only and is not investment advice. Trading carries risk, and leveraged trading in particular can result in the loss of your entire principal. The figures cited are historical measurements over specific windows and do not predict future results.