
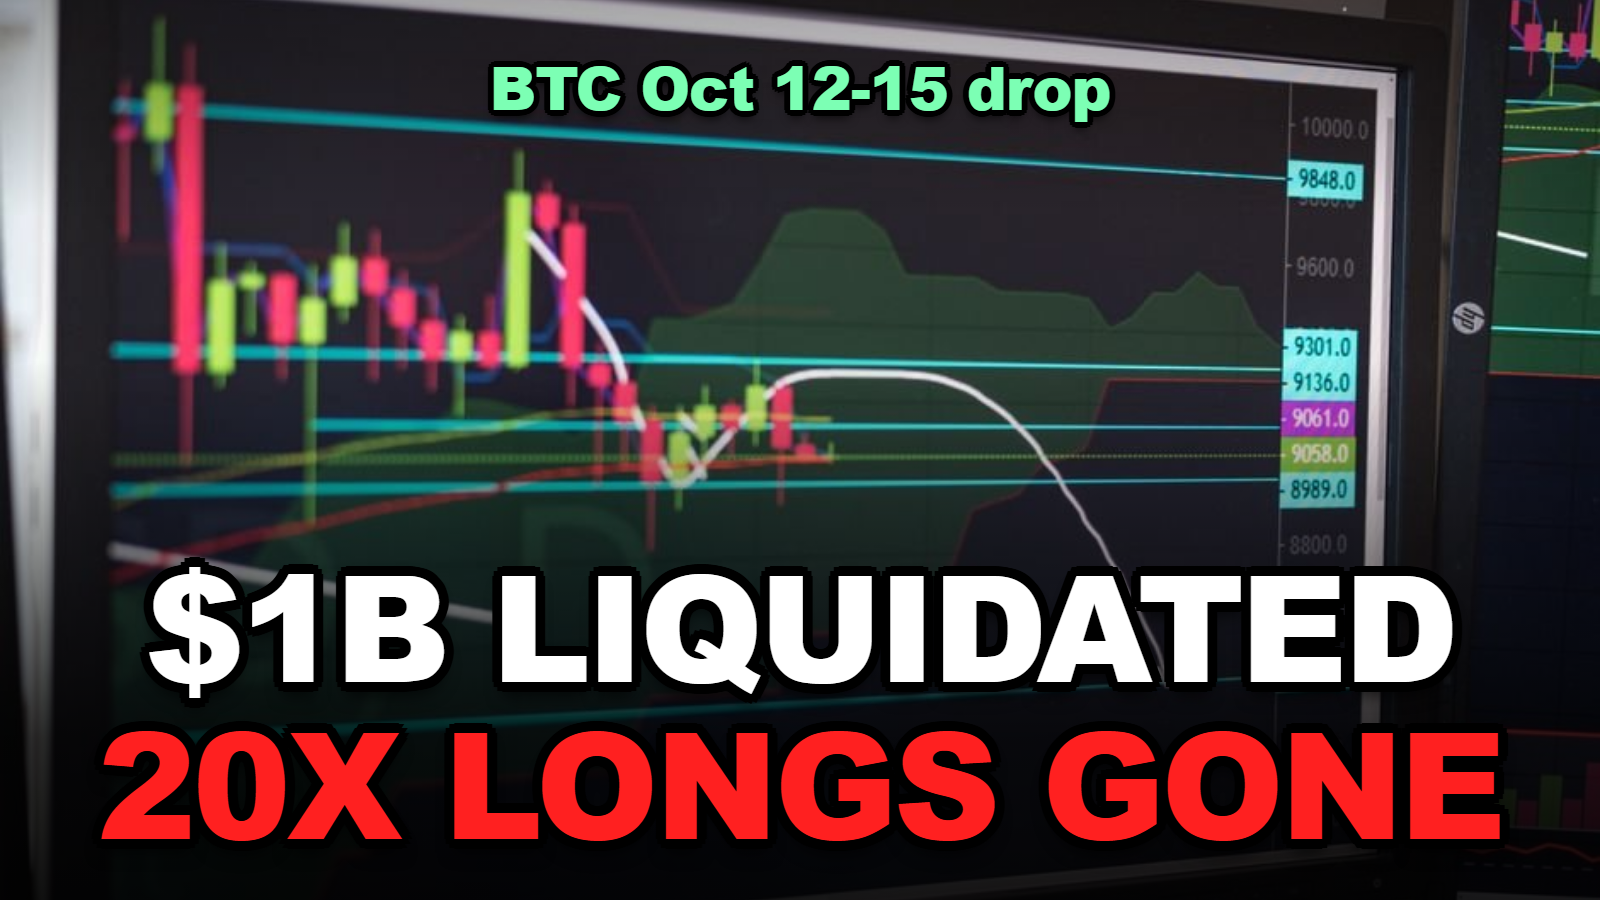
Nearly $1 Billion Liquidated in a Day: The Bitcoin Liquidation Ladder From 3x to 100x, and Why a 5% Drop Took Out Every 20x Long (October 2026)
Short answer: Bitcoin fell from about $84,200 on October 12 to just above $80,000 on October 15, 2026. That is a 5% move. On a standard 0.4% maintenance margin, a 5% drop liquidates every isolated long at 20x or higher that was opened near the top. The 25x line sat at roughly $81,170 and the 50x line at $82,850, both hit on the first day. A 10x long survives until about $76,100 and never came close. Nearly $1 billion was liquidated in 24 hours by October 15, and on the worst day 89% of it was longs.
Every big liquidation day produces the same two headlines: a dollar figure and a word like “wiped.” Neither tells you the only thing a trader needs to know, which is how far the price had to move to take out a position at each leverage level.
So here is that number, worked out from an exchange’s published margin formula and this week’s actual prices.
Not investment advice. Crypto futures can lose more than your margin. Prices and liquidation data are from CoinDesk and CoinGlass-sourced reporting for October 12–15, 2026; the margin formula is Bybit’s published one. Your exchange’s tiers and mark price will differ.
What This Covers
- How far did Bitcoin actually fall this week?
- The Liquidation Ladder: Where Each Leverage Level Died
- Why were 89% of the liquidations longs?
- Does positive funding mean the selling is over?
- How much leverage survives a CPI week?
- What does the ladder leave out?
- Tips
- Warnings
- FAQ
- Sources
How far did Bitcoin actually fall this week?
Bitcoin dropped from about $84,200 on October 12, 2026 to $81,382 by that Monday evening, a 24-hour fall of 2.8%, and then slid to just above $80,000 at about 02:30 UTC on October 15, which is roughly 5% below the Monday start (FinanceFeeds, October 13, 2026; CoinDesk, October 15, 2026).
The sequence, as reported:
- Monday, October 12. Bitcoin broke below $82,000. CoinGlass data cited by The Block showed $771 million of positions liquidated in 24 hours, $685.6 million of it longs. The single largest was a $9.65 million Bitcoin long on Binance.
- Wednesday, October 14. The September CPI print came in hot. Odds of an October Fed hike jumped from about 22% to nearly 47% before easing to about 26%.
- Thursday, October 15. South Korea’s Kospi fell 8% and tripped circuit breakers. Bitcoin touched just above $80,000, near its October 8 low of about $80,300, then recovered to about $81,200. Liquidations over 24 hours approached $1 billion, up from about $136 million the day before, with roughly $200 million of ether longs and $115 million of bitcoin.
A 5% move over four days is not dramatic by Bitcoin standards. The liquidation totals say leverage was positioned as if it could not happen.
The Liquidation Ladder: Where Each Leverage Level Died
For an isolated long with no added margin, the liquidation price is approximately the entry price multiplied by one minus one over the leverage, plus the maintenance margin rate. Bybit’s help centre gives the BTC maintenance margin rate as 0.4% of position value for positions up to 100,000 USDC, rising to 0.5% at 1,000,000 USDC (Bybit Help Centre, maintenance margin).
When I compared that formula against this week’s prices, using an entry of $84,200 at the Monday start, I found that the lines fall exactly where the liquidation headlines came from.
| Leverage | Drop that liquidates | Liquidation price from $84,200 | Hit this week? |
|---|---|---|---|
| 100x | 0.6% | $83,695 | Yes, within hours on October 12 |
| 50x | 1.6% | $82,853 | Yes, October 12 |
| 25x | 3.6% | $81,169 | Yes, by October 15 (Monday close was $81,382) |
| 20x | 4.6% | $80,327 | Borderline. October 15 low was “just above $80,000”; depends on your exchange’s mark price |
| 10x | 9.6% | $76,117 | No |
| 5x | 19.6% | $67,697 | No |
| 3x | 32.9% | $56,470 | No |
Our calculation. Isolated margin, long position, no margin added after entry, 0.4% maintenance margin rate, before fees and funding. Formula: entry × (1 − 1/leverage + 0.004). Prices from FinanceFeeds (October 13) and CoinDesk (October 15), 2026.
Read the right-hand column top to bottom and you have the week. Everything at 25x and above was gone by Thursday morning. The 20x longs lived or died on a few hundred dollars of mark price. Nothing at 10x was touched.
That is the cost of “small” moves. Each step down the ladder roughly halves the leverage and doubles the room.
Why were 89% of the liquidations longs?
On October 12, 2026, longs made up $685.6 million of the $771 million liquidated, or 88.9%, because the market entered the week with more leveraged long positions than short ones and a falling price only triggers the long side of the book.
Two data points from the same reports explain the skew:
- Bitcoin futures open interest on CoinGlass fell from about $54.46 billion to $52.72 billion through the Monday flush. That is leverage leaving the market by force, not by choice.
- By October 15, CoinDesk noted that Bitcoin’s notional open interest rose 1.6% over 24 hours while the price fell, which implies the number of contracts grew about 3.7%. People were adding longs into the dip even as the previous batch was being closed out.
Most people skip this and regret it. When longs are being liquidated and open interest in contracts is still growing, the next leg down has fresh fuel.
Our earlier piece on why positions get liquidated before a stop-loss triggers covers the mark price mechanics that decide whether your 20x long was in the “borderline” row or not.
Does positive funding mean the selling is over?
No. Bitcoin’s perpetual funding rate stayed positive through the October 12–15, 2026 drop, which means longs were still paying shorts to hold their positions; positive funding during a sell-off signals that the long side remains crowded, not that the decline has ended (CoinDesk, October 15, 2026).
The exchange-level picture on October 12, from Glassnode data cited by FinanceFeeds, was mixed: an open-interest-weighted aggregate of 0.003%, positive on Binance and Deribit, flat on Bybit and negative on Hyperliquid. By Thursday CoinDesk still described Bitcoin, ether and solana funding as positive.
Here is the number that surprises people. At 0.003% paid three times a day, a $10,000 long pays about 90 cents a day in funding. Funding did not hurt anyone this week. The direction of the price did.
What funding tells you is positioning. When it goes properly negative, as it did on Hyperliquid, shorts are paying and the crowd has flipped. We looked at that case in negative funding rates and short-squeeze risk.
How much leverage survives a CPI week?
With a 0.4% maintenance margin, the maximum isolated leverage that survives a 5% adverse move is about 18x, and the maximum that survives a 10% move is about 9.6x, because the allowed drop equals one over the leverage minus the maintenance margin rate.
Turn the ladder around and it becomes a sizing rule:
| Move you want to survive | Max leverage (0.4% MMR) | When that move happens |
|---|---|---|
| 3% | 29x | Any ordinary day; this week’s Monday was 2.8% |
| 5% | 18x | A CPI or PPI week like October 12–15, 2026 |
| 10% | 9.6x | A bad week with a macro shock on top |
| 20% | 4.9x | A bear-market month |
Our calculation: max leverage = 1 ÷ (move + 0.004). Isolated margin, no margin added.
This week’s drop was 5%. So the honest version of the rule is: if you held more than about 18x into a scheduled inflation print, the market did not need to do anything unusual to remove you.
What does the ladder leave out?
The liquidation ladder above ignores trading fees, funding payments, cross-margin effects, higher maintenance tiers on large positions and auto-deleveraging, and each of those moves the real liquidation price closer to entry than the table shows.
- Fees. The entry fee comes out of margin on day one. On a 50x position a 0.055% taker fee is about 2.75% of your margin before the price moves.
- Funding. Small this week, but it is paid from margin every eight hours while you hold.
- Tiers. Bybit’s rate rises to 0.5% at 1,000,000 USDC of position value. Big positions have less room, not more.
- Cross margin. Your whole balance backs the position, which pushes the liquidation price further away but puts the whole account at risk. The trade-off is in our isolated vs cross margin comparison.
- Mark price. You are liquidated on the exchange’s mark price, not the last trade. That is why the 20x row says “borderline.”
Tips
- Before a scheduled print, divide 1 by the move you are willing to survive and subtract nothing fancy. That is your leverage ceiling.
- Check your exchange’s own maintenance margin table. 0.4% is Bybit’s BTC entry tier; others differ.
- Watch contract-count open interest, not just dollar open interest. Rising contracts into a falling price means fresh leverage is arriving.
- If you add margin to avoid liquidation, write down the new liquidation price. Most people do not, and get surprised twice.
Warnings
- Liquidation data is aggregated from exchange feeds and totals differ by source. Treat the dollar figures as scale, not precision.
- The ladder is for isolated longs. Shorts, cross margin and multi-tier positions follow different arithmetic.
- Leverage does not change the odds of a move. It only changes whether you are still there when it reverses.
- Futures trading can lose more than the margin posted on some venues. Read your exchange’s terms.
FAQ
Why was my 20x long liquidated when the price never printed my liquidation price?
Exchanges liquidate on the mark price, which is derived from an index of spot prices, not on the last traded price of the perpetual. During fast moves the mark price can touch a level the perpetual’s chart never shows.
Does a lower maintenance margin rate make a position safer?
Slightly. The maintenance margin rate is subtracted from the room you have, so a 0.4% rate gives marginally more cushion than 0.5%. At 20x the difference is a tenth of a percent of price, which is small next to the leverage itself.
Is $1 billion in daily liquidations unusual for Bitcoin?
It is large but not record territory. Reported totals cluster between a few hundred million and about a billion dollars on sharp down days, and the October 15, 2026 figure sat at the top of that range after a week of macro shocks.
Sources
- Bybit Help Centre — Maintenance Margin (USDC Perpetual Contracts): 0.4% BTC rate and formula
- FinanceFeeds — $771M liquidated as Bitcoin lost $82,000 (October 13, 2026; CoinGlass and Glassnode data)
- CoinDesk — Bitcoin rebounds from near $80,000 as Kospi plunges 8% (October 15, 2026)
🔗 Related guides
Fact-checked against Bybit’s maintenance margin documentation and CoinDesk and FinanceFeeds market reports as of October 16, 2026. Figures are our calculations from those sources; this is not investment advice.