
Bitcoin ETFs Lose $305M as IBIT Outflow Streak Hits Five
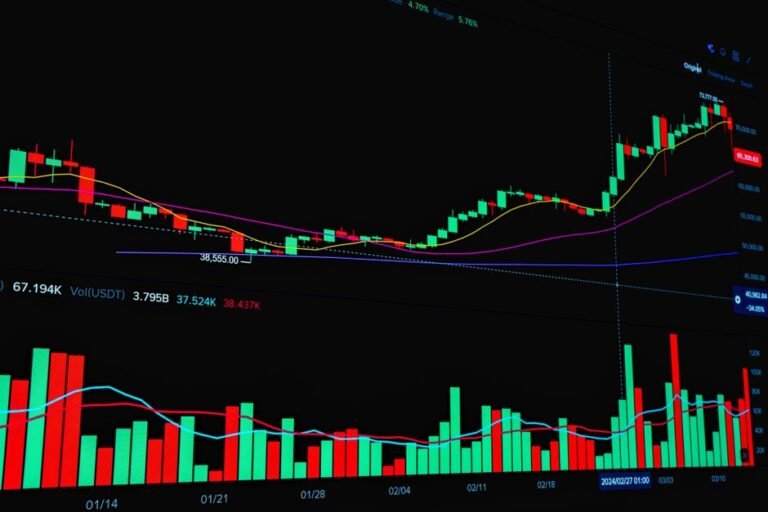
Short answer: U.S. spot bitcoin ETFs lost about $305 million on Thursday, November 5, 2026: roughly $200 million from Fidelity’s FBTC and $105 million from BlackRock’s IBIT, whose outflow streak reached five sessions (Farside Investors via CoinDesk). Bitcoin fell 5.3% in 24 hours to about $75,200 before steadying near $76,150. Over $1 billion in leveraged positions were liquidated.
Educational content, not investment, legal or tax advice. Figures come from the sources listed below, were read on November 7, 2026, and can be revised.
Thursday was a bad day for anyone holding bitcoin through an ETF. A tech-stock rout dragged crypto down, and the two biggest spot funds both saw money leave.
This write-up is built as questions. Pick the one you came with.
Questions Covered
- How much did spot bitcoin ETFs lose on November 5?
- Why did bitcoin fall 5.3% in one day?
- How big was the liquidation wave?
- What do the derivatives numbers say now?
- What should an ETF holder actually check?
How much did spot bitcoin ETFs lose on November 5?
U.S. spot bitcoin ETFs lost roughly $305 million on Thursday, November 5, 2026 across the two funds CoinDesk named, according to Farside Investors data cited in its November 6 market report.
| Fund | Thursday flow (Nov 5, 2026) | Streak noted |
|---|---|---|
| Fidelity FBTC | about -$200 million | not stated |
| BlackRock IBIT | -$105 million | Fifth straight session of outflows |
| Sum of the two | about -$305 million | n/a |
When I checked the CoinDesk piece, I found that it quotes only those two funds in the article body. A separate related headline on the same page puts the all-fund total at $430 million, but that is a headline, not a breakdown I could verify, so treat it as a pointer rather than a number.
A quick conversion helps. $305 million at a bitcoin price of about $76,150 is roughly 4,005 BTC (305,000,000 / 76,150). That is an approximation: ETFs redeem at net asset value, not at the exact spot print.
Why did bitcoin fall 5.3% in one day?
Bitcoin fell 5.3% in the 24 hours before CoinDesk’s November 6, 2026 report because a tech-stock selloff spread into crypto, with the Nasdaq Composite down 5.5% on Thursday.
CoinDesk attributes the Nasdaq drop to fears that Democratic control of Congress will slow the buildout of AI data centers. Ether fell harder, 7.3% over the same window, before gaining 0.3%.
| Asset / index | Move | Window |
|---|---|---|
| Bitcoin (BTC) | -5.3% | 24 hours to Nov 6 |
| Ether (ETH) | -7.3% | 24 hours to Nov 6 |
| Nasdaq Composite | -5.5% | Thursday, Nov 5 |
| Monero (XMR) | -3.2% | 24 hours |
Bitcoin bounced from about $75,200 near 23:00 UTC Thursday and traded around $76,150 after midnight UTC. Same day, it held up slightly better than the equity index it was following.
That correlation is the story. Bitcoin sold off with AI-linked stocks, not on a crypto-specific event.
How big was the liquidation wave?
More than $1 billion in leveraged crypto positions were liquidated in the 24 hours to November 6, 2026, according to CoinGlass data cited by CoinDesk, and the derivatives section puts the figure at $1.27 billion, about $1.1 billion of it longs.
I worked out the split: $1.1 billion of $1.27 billion is about 86.6% long liquidations. In plain terms, traders betting on higher prices took almost all the damage.
| Metric | Value | Calculation |
|---|---|---|
| Total liquidations (24h) | $1.27 billion | CoinGlass via CoinDesk |
| Long share | about $1.1 billion | Same source |
| Long share of total | about 86.6% | 1.1 / 1.27 |
| BTC open interest | $22.1B, up from $21.8B | +$0.3B, about +1.4% |
Here’s the odd part. Open interest rose even after a flush. CoinDesk reads that as leverage being cleared and then rebuilt, not added on top.
What do the derivatives numbers say now?
As of November 6, 2026, bitcoin options and futures showed traders paying up for downside protection: the 1-week 25-delta skew steepened to about 15% from about 11% a week earlier (CoinDesk analysis).
| Indicator | Reading on Nov 6, 2026 |
|---|---|
| Funding rate | Briefly -5% annualized on Bybit, 0 to 5% elsewhere |
| 3-month futures basis | 5.7% |
| 24h put/call volume | About 51/48 in favor of puts |
| Support cluster | $74,000 to $75,000 (Binance liquidity heatmap) |
| Resistance | $76,800 to $77,000 |
Funding that dips negative and then returns to normal usually means shorts piled in briefly. It is not a forecast. A basis of 5.7% says futures still trade above spot, which is a calmer signal than the skew.
Honestly, the numbers say fear, not capitulation.
What should an ETF holder actually check?
A spot bitcoin ETF holder in the United States can see whether their fund is part of the outflow by reading the issuer’s daily flow or holdings page, because flows are published per fund and not only in aggregate.
- Look at your fund’s own flows, not the headline total. FBTC and IBIT moved by very different amounts on the same day.
- Check your fee and your cost basis. A one-day outflow does not change either.
- If you borrowed or hold leverage elsewhere, check your liquidation price against the $74,000 to $75,000 cluster CoinDesk flagged.
- Write down the date you would re-evaluate. A five-session outflow streak is a data point, not a signal to trade.
For how the product wrappers differ, see 3x Bitcoin ETF Approved, Not Trading: The Decay Math. For buying outside an ETF, Schwab Crypto Opens to All Clients: 0.75% vs Coinbase vs ETF compares the fees.
Tips
- Compare flows for the same trading day across sources; Farside, issuers and news sites sometimes round differently.
- Treat related headlines as leads and confirm them on the primary page.
- Keep position size small enough that a 5% daily swing does not force a decision.
Warnings
- This is not investment advice. Bitcoin can fall further or reverse within hours.
- Leveraged products can lose the full amount invested.
- Figures here are a snapshot from November 5 to 6, 2026 and may be revised.
FAQ
Did bitcoin ETFs lose money every day this week?
CoinDesk says only that BlackRock’s IBIT extended its outflow streak to five sessions as of Thursday, November 5, 2026. It does not give a day-by-day table for every fund, so check Farside Investors for the full series.
Is $305 million a large ETF outflow?
It equals roughly 4,005 BTC at about $76,150, which is small next to the $1.27 billion liquidated in derivatives over the same 24 hours. Size matters less than direction here: it is the fifth straight outflow session for IBIT.
Does an ETF outflow mean the price must keep falling?
No. Outflows show net redemptions on a given day, and CoinDesk reports bitcoin steadying near $76,150 after the drop. Prices also depend on derivatives positioning, macro data and equity markets.
Sources
- CoinDesk: Bitcoin steadies after AI-led selloff (November 6, 2026)
- Farside Investors: Bitcoin ETF flow data
- CoinGlass: liquidation data
Next step: open your own fund’s issuer page today, note its flow and your liquidation level if you use leverage, and set a calendar date to review rather than reacting to the next headline.
Fact-checked against CoinDesk’s November 6, 2026 report as of November 7, 2026. Not investment or tax advice.
🔗 Related guides