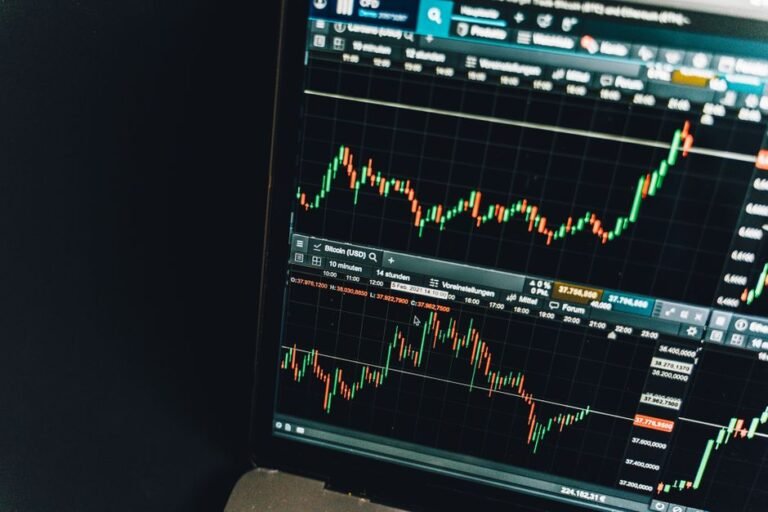

FuturesAI Scoreboard: Losing Streaks at a 45.8% Hit Rate
A hit rate of 45.8% sounds like a number you could live with, until you count how many misses in a row it produces over a normal stretch of trades.
Short answer: FuturesAI’s public scoreboard, read on November 16, 2026, shows 148 right out of 323 scored predictions, or 45.8%. At that hit rate, a run of five or more misses in any 100 trades is about 91% likely, and a run of eight or more is about 28% likely. This post turns those odds into account drawdown at three risk sizes. It is arithmetic, not a forecast.
Educational content, not investment advice. Leveraged futures can lose the full principal, and FuturesAI makes no profit promise. Streak odds are calculated from the published hit rates, assume each trade is independent, and describe luck, not what will happen to you.
See the payback rates on FuturesAI
Contents
- What hit rate does the scoreboard actually show?
- How long a losing streak should you expect in 100 trades?
- How much of an account does a losing streak cost?
- What does this arithmetic leave out?
- Setting a Stop-Trading Rule Before the Streak Arrives
What hit rate does the scoreboard actually show?
FuturesAI’s prediction scoreboard, last auto-checked on November 15, 2026, lists 148 correct direction calls out of 323 predictions, a 45.8% accuracy, with a payoff ratio of 1.19.
When I checked the market split on the same page, I found that crypto sits higher than the total, at 51.1% (48 of 94 calls). KR stocks are at 41.2% (54 of 131) and US stocks at 46.9% (53 of 113). The page states that its returns are calculated with no fees.
The payoff ratio is the money made when right divided by the money lost when wrong. At 1.19, a win is slightly bigger than a loss, but not by much.
Both hit rates matter for what follows. The overall 45.8% is the broad record. The crypto 51.1% is the closest thing to a coin flip, and it comes from a smaller sample.
How long a losing streak should you expect in 100 trades?
At a 45.8% hit rate, the chance of at least one run of six or more consecutive misses somewhere in 100 trades is about 70%, and the typical longest run is 6 misses.
The math is a simple state count: track how many misses in a row you are on, trade by trade, and add up the paths that reach the target length. I ran it for 100 trades and for the full 323 scored calls.
| Run of misses in a row | At 45.8% (overall), in 100 trades | At 51.1% (crypto), in 100 trades |
|---|---|---|
| 5 or more | 90.7% | 77.8% |
| 6 or more | 70.1% | 50.4% |
| 7 or more | 46.6% | 28.3% |
| 8 or more | 28.1% | 14.7% |
| 10 or more | 8.9% | 3.6% |
Own calculation from the hit rates on FuturesAI’s scoreboard (November 16, 2026), assuming independent trades. Over all 323 scored calls at 45.8%, a run of 10 or more misses is about 27% likely.
Read the first row slowly. Five misses in a row is not bad luck at 45.8%. It is the default.
The sample matters too. Crypto’s 94 calls are far fewer than the 323 overall, so a 51.1% there could easily sit anywhere from the mid-40s to the high 50s on a fresh set of calls.
How much of an account does a losing streak cost?
A streak of eight consecutive losing trades costs about 7.7% of an account when each trade risks 1% of the balance, and about 33.7% when each risks 5%, ignoring fees.
The formula is one minus (one minus the risk per trade) raised to the number of losses. Each loss shrinks the balance, so the next 1% is 1% of a smaller number.
| Risk per trade | 5 losses in a row | 8 losses in a row | 10 losses in a row |
|---|---|---|---|
| 1% of the account | -4.9% | -7.7% | -9.6% |
| 2% of the account | -9.6% | -14.9% | -18.3% |
| 5% of the account | -22.6% | -33.7% | -40.1% |
Here is where people get tripped up. Recovering a 33.7% loss needs a gain of about 51%, not 33.7%, because the gain applies to the smaller balance.
Now put the two tables together. At a 5% risk size and the overall 45.8% hit rate, a 28% chance of an eight-loss run in 100 trades means a better-than-one-in-four chance of a drawdown near a third of the account.
Fees only make it worse. FuturesAI’s scoreboard states it is calculated with no fees, so real trades on an exchange would run slightly below these numbers. For how that gap is worked out, see FuturesAI Scoreboard: Where Break-Even Accuracy Sits at 1.19.
What does this arithmetic leave out?
This streak math leaves out three things: trades are not perfectly independent, hit rates drift as markets change, and the scoreboard counts direction calls rather than your actual entries and exits.
- Dependence. Calls made in the same week on correlated assets can all miss together, which makes real streaks clumpier than the table shows.
- Drift. A 45.8% record over 323 calls is a measured average, not a promise. Over a different window the hit rate could be higher or lower.
- Execution. You do not enter at the frozen price. Slippage and fees move the result.
I noticed that the scoreboard itself notes the index comparison can be off by up to a day because of daily closes. That is a reminder to treat every figure here as approximate.
One more check on the same page. It says traded as predicted, the record returned an average of +0.05% per call against a market move of +2.12% over the same windows, a gap of -2.08 percentage points. Streaks are only half the story.
Setting a Stop-Trading Rule Before the Streak Arrives
Decide your stopping point while the account is full, because after five losses in a row nobody picks a number calmly.
- Pick your hit rate. Use the measured one for the market you trade, not the one you hope for.
- Look up the 8-loss row in the first table. That is how often you should expect it in 100 trades.
- Choose a risk size from the second table. Be honest about the drawdown you can stomach.
- Write a pause rule, for example: after 6 losses in a row, stop for the day and review fills.
- Re-run the numbers every 100 trades with your own record.
For sizing after fees, see FuturesAI Kelly: How to Size a Trade After Fees.
See the payback rates on FuturesAI
Tips
- Size for the streak, not the average. Your account has to survive the run you will probably see.
- Track your own hit rate by market. The crypto and stock numbers differ a lot on the scoreboard.
- Count fees on every trade. They shave the edge even when the streak is short.
- Write the stop rule down before the first trade of the day.
Warnings
- These odds assume independent trades. Real streaks can be longer when assets move together.
- A published hit rate describes the past sample only. Nothing here predicts your results.
- Leverage can lose the entire principal, not just the percentages above.
- Do not raise your risk size to win back a drawdown. The table shows why that backfires.
FAQ
How many losses in a row are normal at a 45.8% hit rate?
Over 100 trades, a run of five or more consecutive misses is about 91% likely, and the typical longest run is around six. Longer runs of eight or more happen in roughly 28% of 100-trade stretches.
Does a higher win rate remove losing streaks?
No. At FuturesAI’s crypto hit rate of 51.1%, a run of six or more misses in 100 trades is still about 50% likely. A higher rate shortens streaks but does not remove them.
How do I size trades to survive a losing streak?
Risk a small fixed percentage per trade. At 1% risk, eight straight losses cost about 7.7% of the account. At 5% risk, the same streak costs about 33.7%.
Sources
Next step: write your pause rule and your risk size on one line before you place the next trade.
Figures from FuturesAI’s public scoreboard as read on November 16, 2026. Streak odds and drawdowns are the author’s own arithmetic and not investment advice.
🔗 Related guides