10-Year Treasury at 5.09% Beats the S&P 500 Earnings Yield
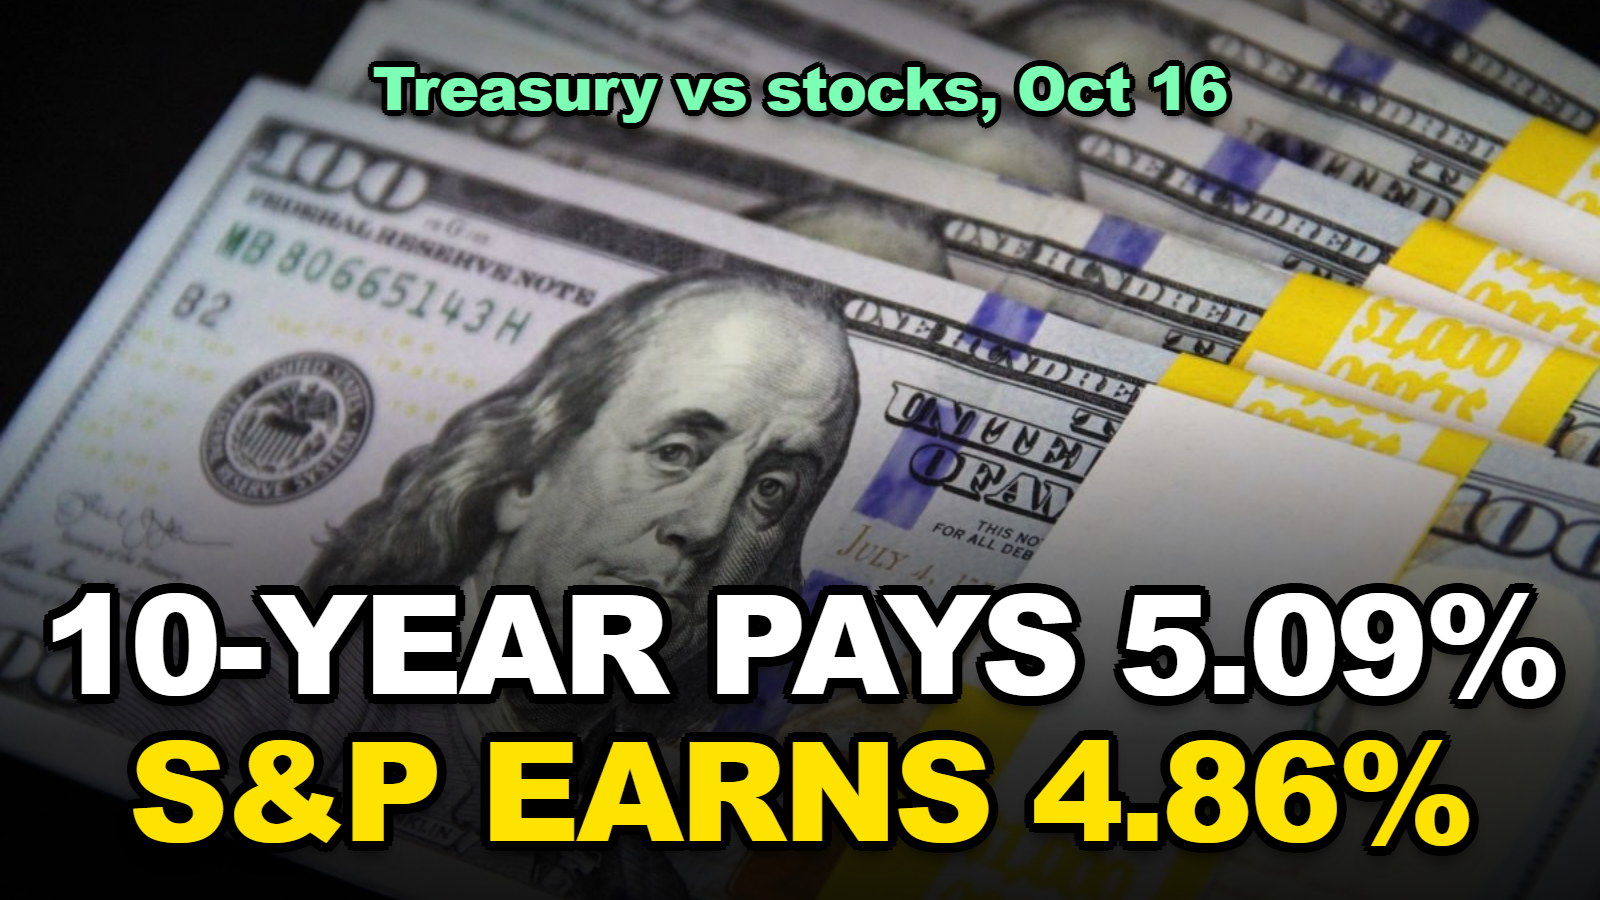
Short answer: On October 16, 2026 the 10-year Treasury yielded 5.09%, according to Treasury’s daily par yield curve. The S&P 500’s forward earnings yield, one divided by the 20.59 forward price-to-earnings ratio on State Street’s SPY page for October 15, is 4.86%. That is 0.23 percentage points below the bond. Stocks still have growth the bond lacks, but a buyer today is no longer paid extra up front for taking equity risk.
A 10-year Treasury now pays more than the S&P 500 earns on its price. That sentence would have sounded odd for much of the last fifteen years.
The comparison is crude, and it is not a timing signal. It is a useful way to see what you are being paid for the risk you choose, so here are the numbers, the math and the limits.
Not investment advice. Treasury figures are from the U.S. Treasury’s Daily Treasury Par Yield Curve Rates for October 16, 2026. Fund figures are from State Street’s SPY page, data as of October 15, 2026. Forward earnings are analyst estimates, not results. The comparisons are my own arithmetic.
What This Compares
- What did Treasuries and the S&P 500 yield this week?
- How big is the gap between the bond and stock earnings?
- What does $10,000 pay each year in each choice?
- What does a stock fund need to earn to match the bond?
- Where does this comparison break down?
- What could move the numbers next week?
- Tips
- Warnings
- FAQ
- Sources
What did Treasuries and the S&P 500 yield this week?
The U.S. Treasury’s par yield curve shows the 10-year note at 5.09% and the 3-month bill at 4.26% on October 16, 2026, down from 5.24% and 4.25% a week earlier on October 9.
| Instrument | Oct 9, 2026 | Oct 16, 2026 | Change (pts) |
|---|---|---|---|
| 3-month Treasury bill | 4.25% | 4.26% | +0.01 |
| 2-year note | 4.80% | 4.74% | -0.06 |
| 5-year note | 5.02% | 4.89% | -0.13 |
| 10-year note | 5.24% | 5.09% | -0.15 |
| 30-year bond | 5.60% | 5.43% | -0.17 |
Source: U.S. Treasury Daily Treasury Par Yield Curve Rates, October 2026.
Longer yields fell about 15 basis points over the week that the Nasdaq composite dropped 4.5%. A falling yield means the 10-year note’s price rose over the same days.
On the stock side, State Street’s page for the SPDR S&P 500 ETF Trust (SPY) lists a price-to-earnings ratio of 24.90 and a forward (FY1) ratio of 20.59 as of October 15, 2026, with an index dividend yield of 1.09% and a fund distribution yield of 0.98%.
How big is the gap between the bond and stock earnings?
The S&P 500’s forward earnings yield is about 4.86% (1 divided by 20.59) and its trailing earnings yield is about 4.02% (1 divided by 24.90), so the 10-year Treasury’s 5.09% sits 0.23 points above the forward figure and 1.07 points above the trailing one.
| Measure | Value | Yield equivalent | 10-year minus this |
|---|---|---|---|
| 10-year Treasury (Oct 16) | 5.09% | 5.09% | — |
| S&P 500 forward P/E 20.59 (Oct 15) | 20.59 | 4.86% | 0.23 pts |
| S&P 500 trailing P/E 24.90 (Oct 15) | 24.90 | 4.02% | 1.07 pts |
| SPY index dividend yield (Oct 15) | — | 1.09% | 4.00 pts |
When I compared the two earnings measures, I noticed that the forward number does most of the work. It assumes analysts are right about the next twelve months. State Street also lists an estimated 3-to-5-year EPS growth rate of 21.70% for the index, which is an estimate, not a promise.
What does $10,000 pay each year in each choice?
A $10,000 purchase of a 10-year Treasury at a 5.09% yield pays about $509 a year in interest, while $10,000 in an S&P 500 fund paying a 0.98% distribution yield pays about $98 a year in dividends.
| $10,000 in… | Yearly cash paid | Where the rest must come from |
|---|---|---|
| 10-year Treasury at 5.09% | about $509 | Nothing. Principal returns at maturity if you hold |
| 3-month bill at 4.26% | about $426 | Nothing, but you must roll it as rates change |
| SPY at 0.98% distribution yield | about $98 | Price gains, which can be negative |
SPY’s gross expense ratio is listed at 0.0945%, which is about $9.45 a year on $10,000. It is small, and it is already inside the fund’s figures.
Honestly, the cash column is the simplest way to see the change. The bond pays you for waiting. The stock fund pays you if the price goes up.
What does a stock fund need to earn to match the bond?
To match a 5.09% Treasury yield over a year, an S&P 500 fund paying a 0.98% distribution yield needs its price to rise about 4.11% a year.
The arithmetic: 5.09% minus 0.98% is 4.11%. Compounding that price gain, with dividends taken as cash and ignored in the price column, gives these levels.
| Years held | Price needed on $10,000 | Price gain required |
|---|---|---|
| 1 | $10,411 | $411 |
| 3 | $11,284 | $1,284 |
| 5 | $12,231 | $2,231 |
| 10 | $14,960 | $4,960 |
That bar is not impossible. Stocks have cleared it in many periods. It is a bar a Treasury holder does not have to clear, which is the point.
I found that most comparisons skip the bond’s side of the risk. A 10-year Treasury guarantees the coupons if held to maturity, but its market price falls when yields rise, so selling early can lock in a loss.
Where does this comparison break down?
The earnings yield versus Treasury yield comparison is a rough valuation check, not a forecast, because earnings can grow while bond coupons are fixed.
- Earnings grow, coupons do not. A bond’s 5.09% stays 5.09%. A company’s earnings can rise.
- Forward earnings are estimates. They are revised, often downward in a weak quarter.
- Inflation matters. The Treasury yield is nominal.
- Tax treatment differs. Treasury interest is generally exempt from state and local income tax, while stock gains and dividends are taxed under different rules.
- One fund is not the whole market. SPY tracks the S&P 500, not every stock.
If you have ever bought a stock because the chart looked strong, you know a ratio never captures everything.
What could move the numbers next week?
Earnings reports and the Federal Reserve’s October 28 meeting are the scheduled events that could move both yields and forward earnings estimates.
According to Stock Titan’s earnings calendar for the week of October 19, Netflix reports on Tuesday, October 20 and Tesla on Wednesday, October 21, both after the close. Calendars can change, so check each company’s investor relations page. A weak guide from a large company can cut the forward earnings the 4.86% figure depends on.
For the rate side, see our earlier piece on what a 25 basis point move does to $10,000 across bills and bonds.
Tips
- ✅ Compare the same horizon: a 3-month bill and a 10-year note are not the same bet.
- ✅ Write down the date next to any P/E you quote. It changes daily.
- ✅ Use the cash-paid column to decide how much of your plan needs to be certain.
- ✅ Check whether your brokerage shows the Treasury yield or the price when you shop for bonds.
Warnings
- This is not a buy or sell signal for stocks or bonds.
- A single day’s yields and ratios can change quickly.
- Bond prices fall when yields rise. Selling before maturity can produce a loss.
FAQ
Is the S&P 500 earnings yield really below the 10-year Treasury yield?
On the figures used here, yes. State Street’s SPY page for October 15, 2026 shows a forward price-to-earnings ratio of 20.59, which is an earnings yield of about 4.86%, while the 10-year Treasury yielded 5.09% on October 16, 2026.
Does a higher Treasury yield mean stocks must fall?
No. A higher Treasury yield raises the return stocks need to look attractive, but stocks can still rise if earnings grow. The comparison measures what you are paid for the risk, not what prices will do next.
How do I calculate an earnings yield?
Divide 1 by the price-to-earnings ratio. A forward P/E of 20.59 gives 1 divided by 20.59, or about 4.86%. A trailing P/E of 24.90 gives about 4.02%.
Sources
- U.S. Department of the Treasury — Daily Treasury Par Yield Curve Rates, October 2026
- State Street — SPDR S&P 500 ETF Trust (SPY), data as of October 15, 2026
- Stock Titan — Earnings calendar, week of October 19, 2026
🔗 Related guides
Fact-checked against the U.S. Treasury’s daily par yield curve for October 2026 and State Street’s SPY page (data as of October 15, 2026). Ratios and dollar comparisons are our own arithmetic. Not investment advice.